How to detect illegal dumping sites using satellite imagery
Someone on the compliance side asks for a map of every dump site in a watershed, a county, a stretch of floodplain. There's no existing dataset. Code enforcement has a spreadsheet of complaints, maybe some site visit photos, nothing spatial and comprehensive. The job lands on GIS: go find them all from imagery.
What satellite imagery actually shows at a dump site
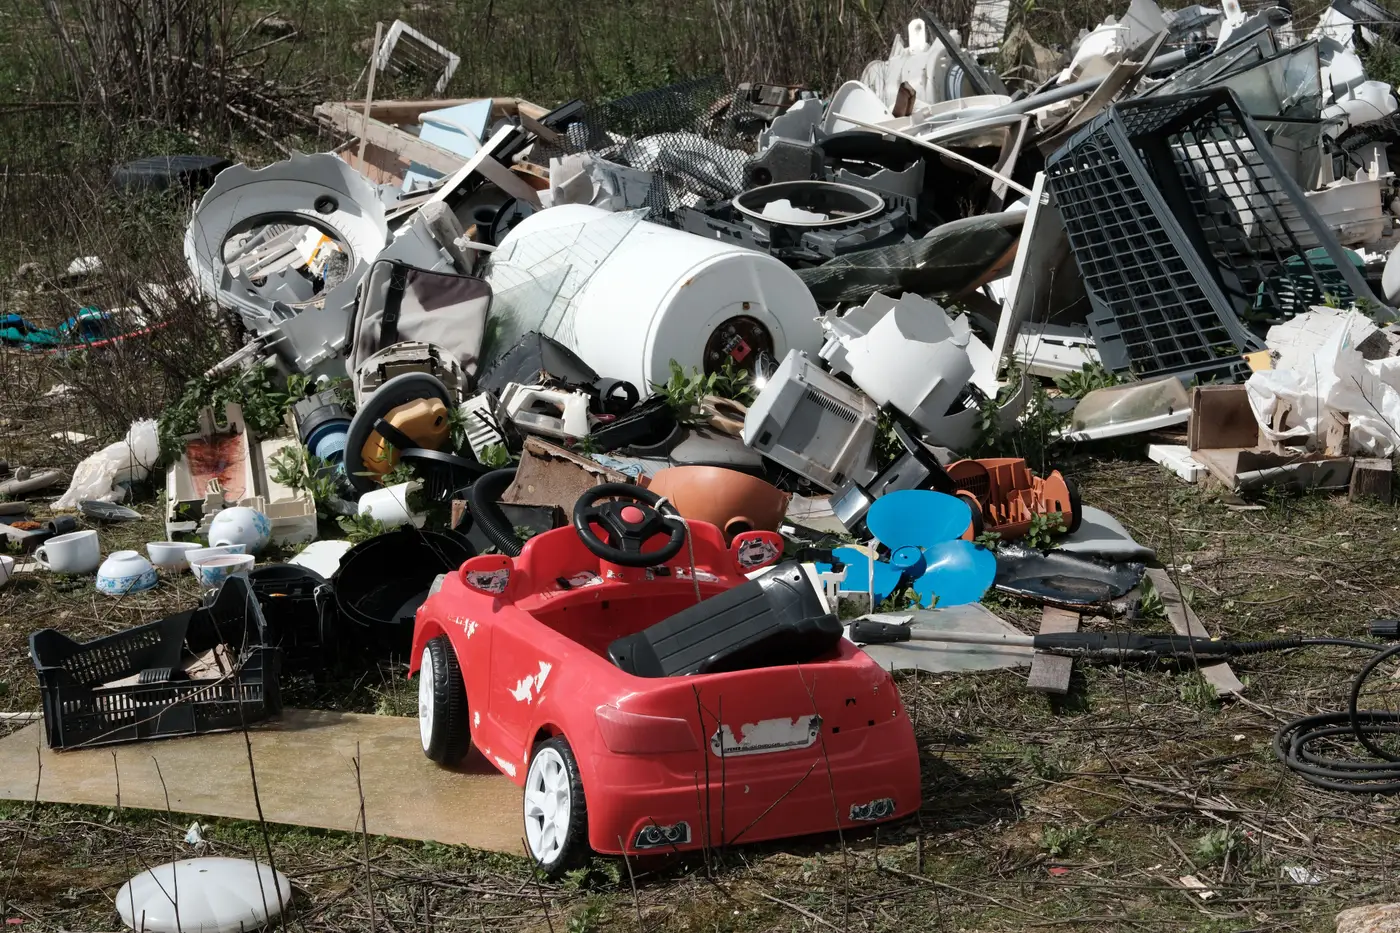
Illegal dumping doesn't have one signature. A construction debris pile looks like a bright, angular scar against green or brown background. Tire piles read as dark, textured clusters that don't match the soil around them. Fly-tipping along a ditch or treeline shows up as a smear of mixed color and shadow that breaks the line of vegetation. None of these look alike to a classifier trained on roads, buildings, or crop types.
At 0.5-2m ground sample distance you can usually tell a dump pile from a woodpile or a parked equipment yard by shape and context: dump sites tend to sit at field edges, pull-offs, and dead-end roads rather than inside a working lot. Below that resolution it turns into guesswork. Multispectral bands help separate bare soil and debris from live vegetation, but the shape and placement still do most of the work for a human eye, and increasingly for a model trained on examples rather than a fixed rule.
Why generic land-cover classifiers skip over them
Off-the-shelf imagery classifiers are built around categories that show up everywhere and look the same everywhere: cropland, impervious surface, forest, water. Illegal dumping is a land-use violation, and its signature shifts with the region. A pile of pallets and roofing material in one county reads differently than tire dumps two states over, and a classifier trained on fixed land-cover categories has nothing to anchor that variation to. No vendor ships a "fly-tipping" class because there's no consistent enough signature across geographies to train one that generalizes.
That leaves two options for a consultancy that needs this mapped: send analysts out to draw polygons tile by tile over however many square miles the project covers, or train something on the specific pattern you're looking for in your specific imagery.
Mapping one site, then the whole county
The manual route works but doesn't scale cleanly. One analyst's idea of "dump site" drifts from another's over a few hundred tiles, and a watershed-scale deliverable can mean weeks of screen time for a handful of confirmed sites per square mile.
The alternative is to treat it as a custom feature class: show a model five or ten confirmed dumping sites you've already identified, labelled directly on your high-res imagery, and let it learn what you're actually pointing at, debris pile, bare-soil scar, mixed-material dump, whatever the pattern is in your project area. Run that against the rest of your coverage and you get back a layer of every instance the model finds, ready to QA and hand to the client or the regulator.
That's the gap Few-Shot Mapping is built around: a workflow for mapping a feature class that doesn't exist in any standard classifier, using a handful of examples you provide instead of a six-month training exercise.
What this takes in practice
Cadence here is project driven, not a standing subscription. You pull the imagery for the area in question, label a representative set of known sites across a range of conditions (different pile sizes, different vegetation backgrounds, different states of weathering), and run the model against the full extent. You get a layer back, not a number. Confirming it against ground truth or recent flyovers is still a project team's job, same as it would be with any new feature class.
If you've got a backlog of dump-site complaints and need them turned into a defensible spatial layer before the next site-visit season, that's the one-off this product was built for.